Information visualization poster work developed in the 2021-22 course of Graphic Design and Infographics, in partnership with the Design Observatory, by Maria Campos Lourenço, Catarina Monteiro and Lia Sá, and under the supervision of Professor Marta Fernandes.
In developing this project, it was possible to translate a large amount of data into rigorous and significantly appealing graphic solutions, transforming them into visual knowledge.
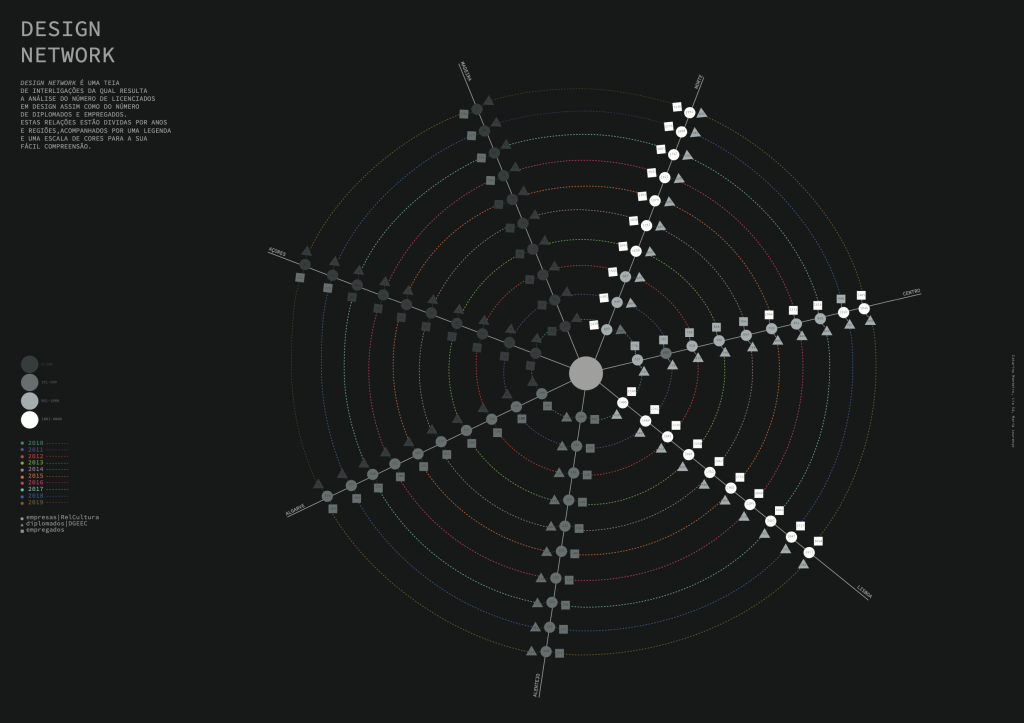
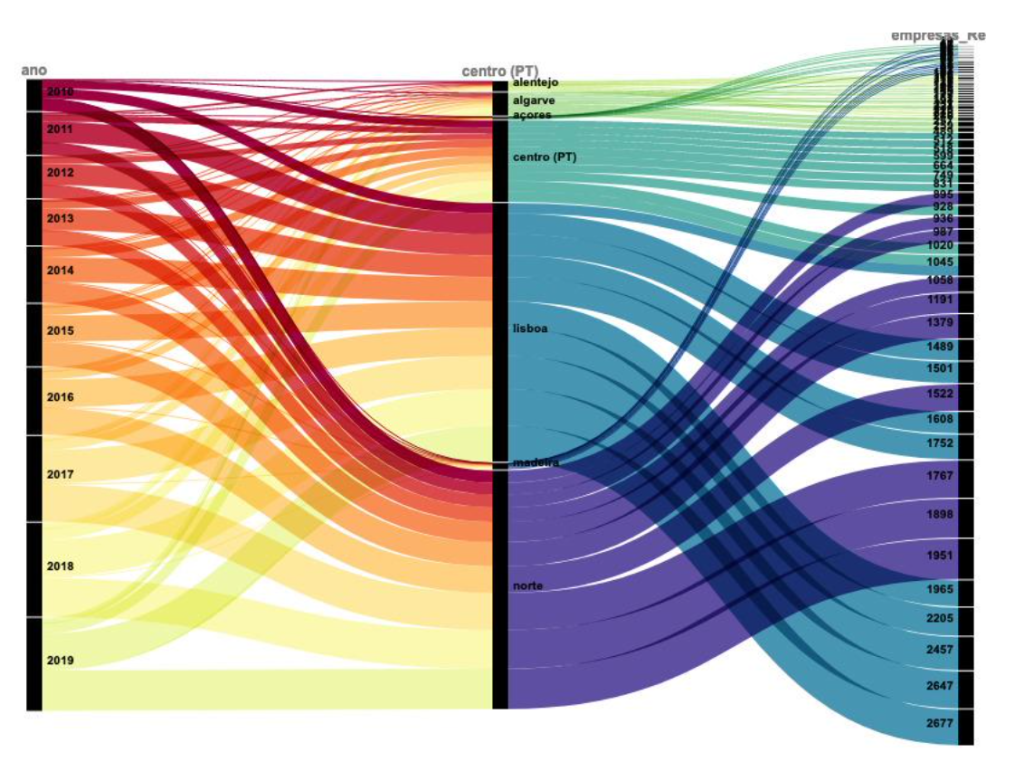
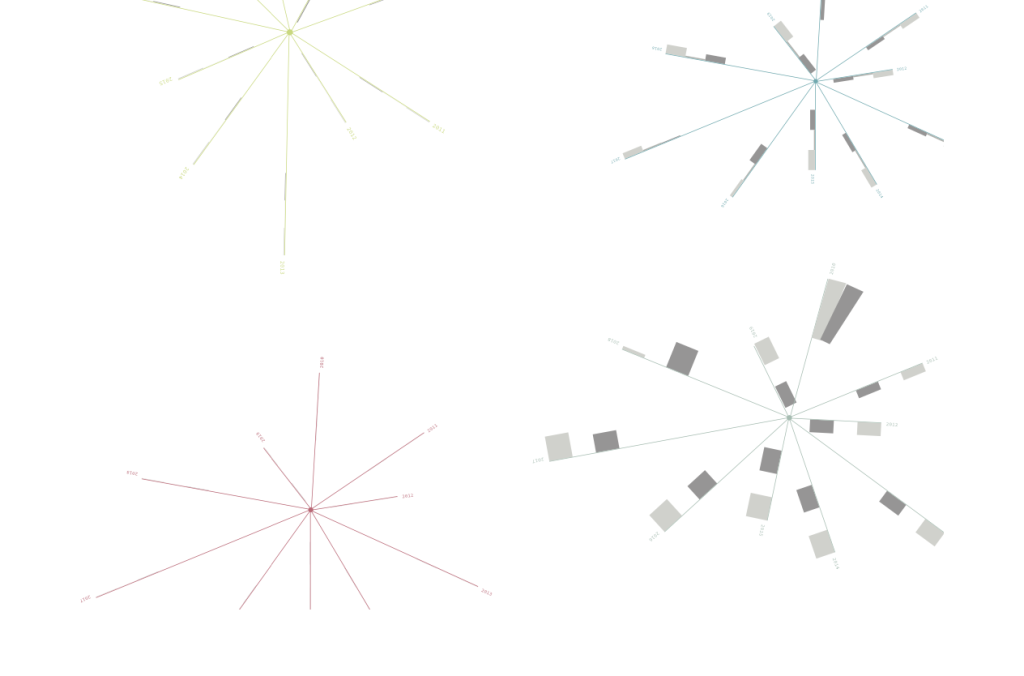
DESIGN NET IS A WEB OF INTERCONNECTIONS WHICH RESULTS IN THE ANALYSIS OF THE NUMBER OF DESIGN LICENSEES AS WELL AS THE NUMBER OF GRADUATES
AND EMPLOYEES.THESE RELATIONS HAVE BEEN DIVIDED FOR YEARS AND REGIONS, ACCOMPANIED BY A LEGEND AND A COLOR SCALE TO ITS EASY TO UNDERSTAND.
When translating, analyzing, and carefully exploring the aforementioned data, we always intended to produce an infographic that was easy to understand and read and could be used by designers, schools/colleges, or the everyday person. (…) as well as several visual structures: graphs, tables, and diagrams, among others, as well as texts and images.
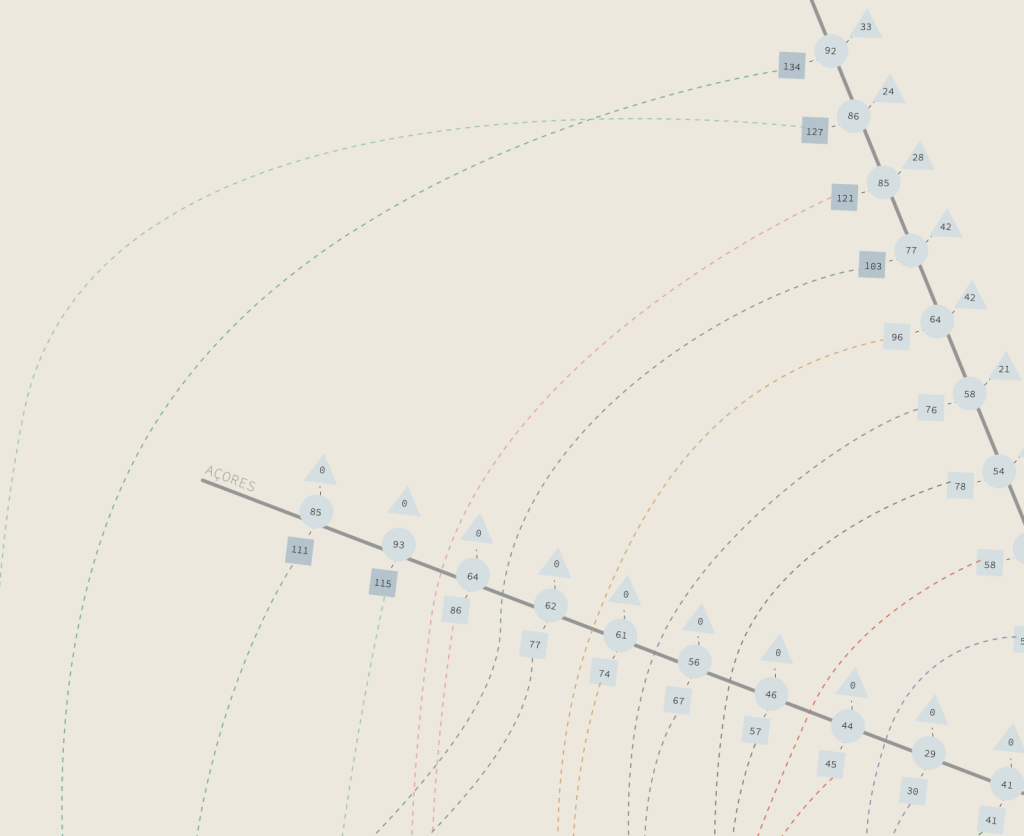
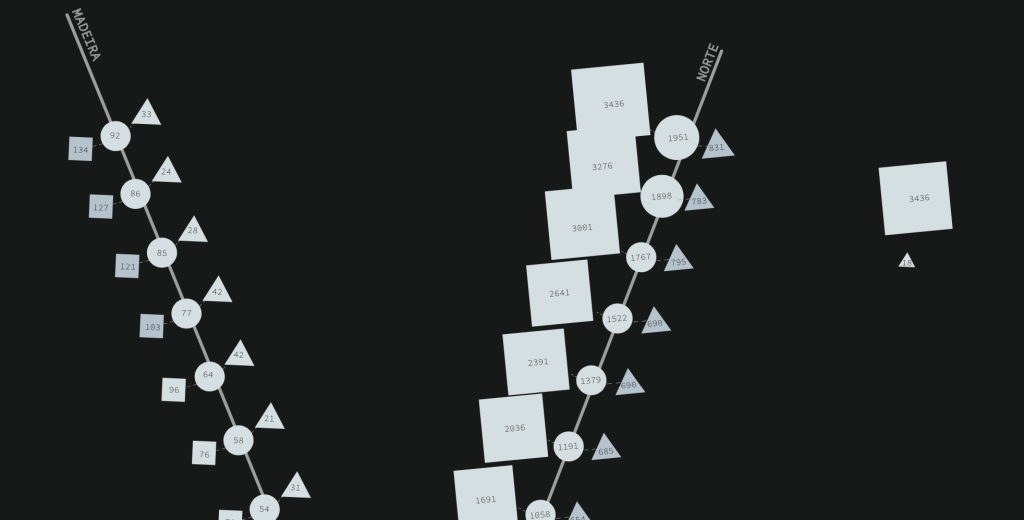
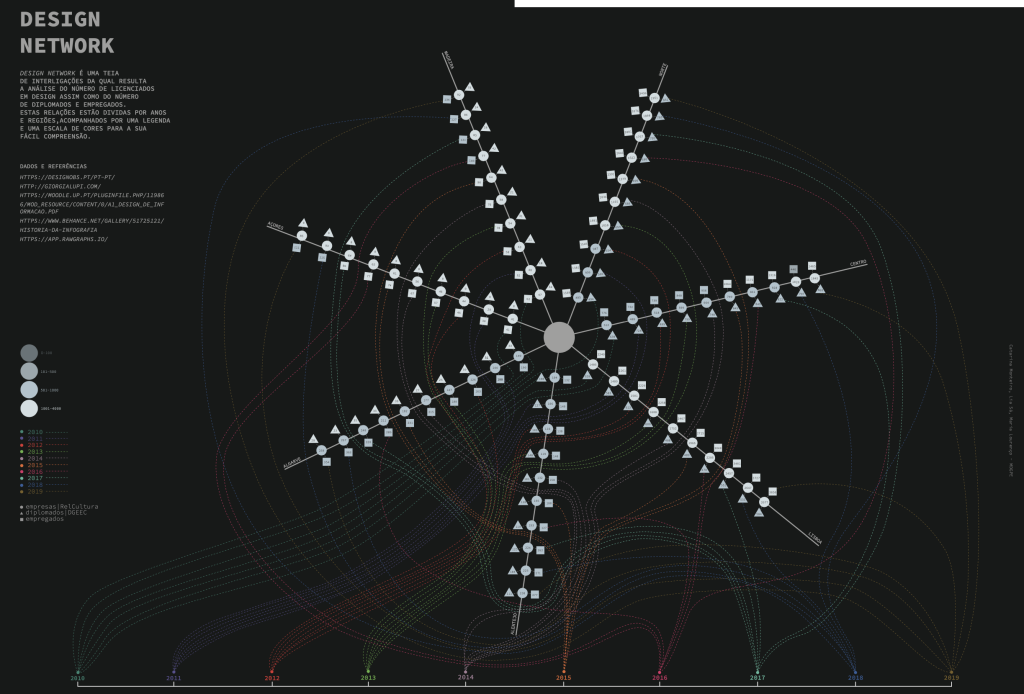
In general, this project reflects research, sketches, and experiences that, throughout the development, were important for understanding and interpreting the data, culminating in the final product.
